Lovely Heap and poor CPU
Let’s assume you’re dealing with a legacy application where most of the logic lives in stored procedures, functions, triggers, and so on.
The app uses a queue implemented on top of SQL Server - not unusual for legacy applications. The interesting part is that the table behind the queue is a Heap with no nonclustered indexes. Let’s call this table Lovely Heap.
The application has hundreds of thousands of tables, and each one has a trigger that inserts one or more rows into Lovely Heap. Okay, okay, not hundreds of thousands - just hundreds. But you get the idea of how everything was built.
Due to an error, Lovely Heap was flooded with millions of rows that would never be removed by the queue processor (which, of course, was just a SQL Server Agent job).
That data is no longer needed, and the decision is simple: delete those rows manually. No sooner said than done.
Suppose that before the deletion, Lovely Heap had ~9k pages, and after the deletion it still had ~6k pages allocated.
Now, make your bets on what happened on your production SQL Server to the stored procedure that reads data from the Lovely Heap table after all invalid rows were deleted:
- 100% it works faster and more efficiently
- Nothing, everything continues to work as before
- It works slower

And surprise! - right after the deletion, CPU utilization went through the roof. Poor CPU…
- Why?
- Who knows…
- How can we help the poor CPU?
- Rebuild Lovely Heap just like this:
1alter table dbo.LovelyHeap rebuild
2-- or if you're on SQL Server Enterprise Edition
3alter table dbo.LovelyHeap rebuild with(online)
Testing
That solved the problem - but what exactly happened, and why did CPU usage skyrocket? To investigate, I will run some tests using the latest and greatest SQL Server 2025 + CU3, starting by preparing the schema and test data:
 1create table dbo.LovelyHeap
 2(
 3	Id			bigint identity(1,1) not null,
 4	QueueId		tinyint not null,
 5	OperationId	tinyint not null,
 6	[Data]		bigint not null,
 7	CreateDate	datetime2(7) not null
 8		constraint DF_LovelyHeap__CreateDate default (sysutcdatetime())
 9)
10go
11create proc dbo.stp_LovelyHeapRead
12(
13	@QueueId tinyint
14)
15as
16set nocount on
17
18delete lh
19output deleted.Id, deleted.OperationId, deleted.[Data]
20from	dbo.LovelyHeap lh with(readpast)
21where QueueId = @QueueId
22go
Next, I inserted some data using SqlQueryStress created by Adam Machanic.
I ran two instances simultaneously to mix the data:
- Instance one ran 10 threads × 100k iterations with no delay
1insert dbo.LovelyHeap(QueueId,OperationId,[Data]) 2select 254 QueueId, 3 floor(rand() * 100) OperationId, -- 0 to 100 4 floor(rand() * 2147483647) [Data] -- 0 to ~2bil 5 6insert dbo.LovelyHeap(QueueId,OperationId,[Data]) 7select 255 QueueId, 8 floor(rand() * 100) OperationId, -- 0 to 100 9 floor(rand() * 2147483647) [Data] -- 0 to ~2bil - Instance two ran 4 threads × 25k iterations with a 1 ms delay
1insert	dbo.LovelyHeap(QueueId,OperationId,[Data])
2select	floor(rand() * 100) + 1 QueueId,	-- 1 to 100
3		floor(rand() * 100) OperationId,	-- 0 to 100
4		floor(rand() * 2147483647) [Data]	-- 0 to ~2bil
Let’s look at index physical stats using this query:
1select  object_name([object_id]) table_name,
2		record_count record_cnt,
3		forwarded_record_count fwd_record_cnt,
4		ghost_record_count ghost_record_cnt,
5		avg_fragmentation_in_percent,
6		page_count page_cnt
7from	sys.dm_db_index_physical_stats(db_id(),null,null,null,'detailed')
8where [object_id] = object_id('dbo.LovelyHeap')
Result:
table_name |
record_cnt |
fwd_record_cnt |
ghost_record_cnt |
avg_fragmentation_in_percent |
page_cnt |
|---|---|---|---|---|---|
LovelyHeap |
2100000 |
0 |
0 |
0 |
9544 |
Now let’s run the stored procedure and collect execution stats (10 threads × 500 iterations):
1declare	@QueueId tinyint = floor(rand() * 100) + 1	-- 0 to 100
2exec dbo.stp_LovelyHeapRead @QueueId = @QueueId
Total execution time was about 1 minute 16 seconds.
To collect execution stats, I will use Query Store and the following query:
 1select	object_name(qsq.[object_id]) proc_name,
 2		rs.count_executions execution_cnt,
 3		rs.avg_duration / 1000.0 avg_duration_ms,
 4		rs.avg_cpu_time / 1000.0 avg_cpu_ms,
 5		rs.avg_logical_io_reads avg_logical_reads,
 6		rs.avg_logical_io_writes avg_logical_writes
 7from	sys.query_store_query qsq
 8		join sys.query_store_plan qsp
 9		on qsp.query_id = qsq.query_id
10		join sys.query_store_runtime_stats rs
11		on rs.plan_id = qsp.plan_id
12where qsq.[object_id] = object_id('dbo.stp_LovelyHeapRead')
Execution stats:
proc_name |
execution_cnt |
avg_duration_ms |
avg_cpu_ms |
avg_logical_reads |
avg_logical_writes |
|---|---|---|---|---|---|
stp_LovelyHeapRead |
5000 |
148.7901908 |
96.8456538 |
9554.45 |
1.454 |
Index physical stats:
table_name |
record_cnt |
fwd_record_cnt |
ghost_record_cnt |
avg_fragmentation_in_percent |
page_cnt |
|---|---|---|---|---|---|
LovelyHeap |
2000000 |
0 |
0 |
0 |
9546 |
Now let’s delete rows for QueueId equal 254 and 255:
1delete dbo.LovelyHeap
2where QueueId in (254, 255)
Index physical stats:
table_name |
record_cnt |
fwd_record_cnt |
ghost_record_cnt |
avg_fragmentation_in_percent |
page_cnt |
|---|---|---|---|---|---|
LovelyHeap |
0 |
0 |
0 |
1.13065326633166 |
6311 |
Insert another 100k rows:
1insert	dbo.LovelyHeap(QueueId,OperationId,[Data])
2select	floor(rand() * 100) + 1 QueueId,	-- 1 to 100
3		floor(rand() * 100) OperationId,	-- 0 to 100
4		floor(rand() * 2147483647) [Data]	-- 0 to ~2bil
Index physical stats:
table_name |
record_cnt |
fwd_record_cnt |
ghost_record_cnt |
avg_fragmentation_in_percent |
page_cnt |
|---|---|---|---|---|---|
LovelyHeap |
100000 |
0 |
0 |
1.13065326633166 |
6311 |
Run stp_LovelyHeapRead again (10 threads × 500 iterations).
This time it took about 4 minutes 48 seconds. Execution stats:
proc_name |
execution_cnt |
avg_duration_ms |
avg_cpu_ms |
avg_logical_reads |
avg_logical_writes |
|---|---|---|---|---|---|
stp_LovelyHeapRead |
5000 |
444.030594 |
305.071358 |
6317.3034 |
0.1564 |
Index physical stats again:
table_name |
record_cnt |
fwd_record_cnt |
ghost_record_cnt |
avg_fragmentation_in_percent |
page_cnt |
|---|---|---|---|---|---|
LovelyHeap |
0 |
0 |
0 |
1.13065326633166 |
6311 |
Avg logical reads decreased as expected, but CPU usage and duration increased 3x! This behavior was unexpected for me. What is going on here?
Execution plan
It doesn’t matter whether the table has rows to return or not - the observed behavior remains the same. From here on, I’ll compare two scenarios to make it simpler:
- Scenario A: table contains 2M invalid rows
- Scenario B: table is logically empty (0 rows)
Let’s run both stored procedures and review their execution plans:
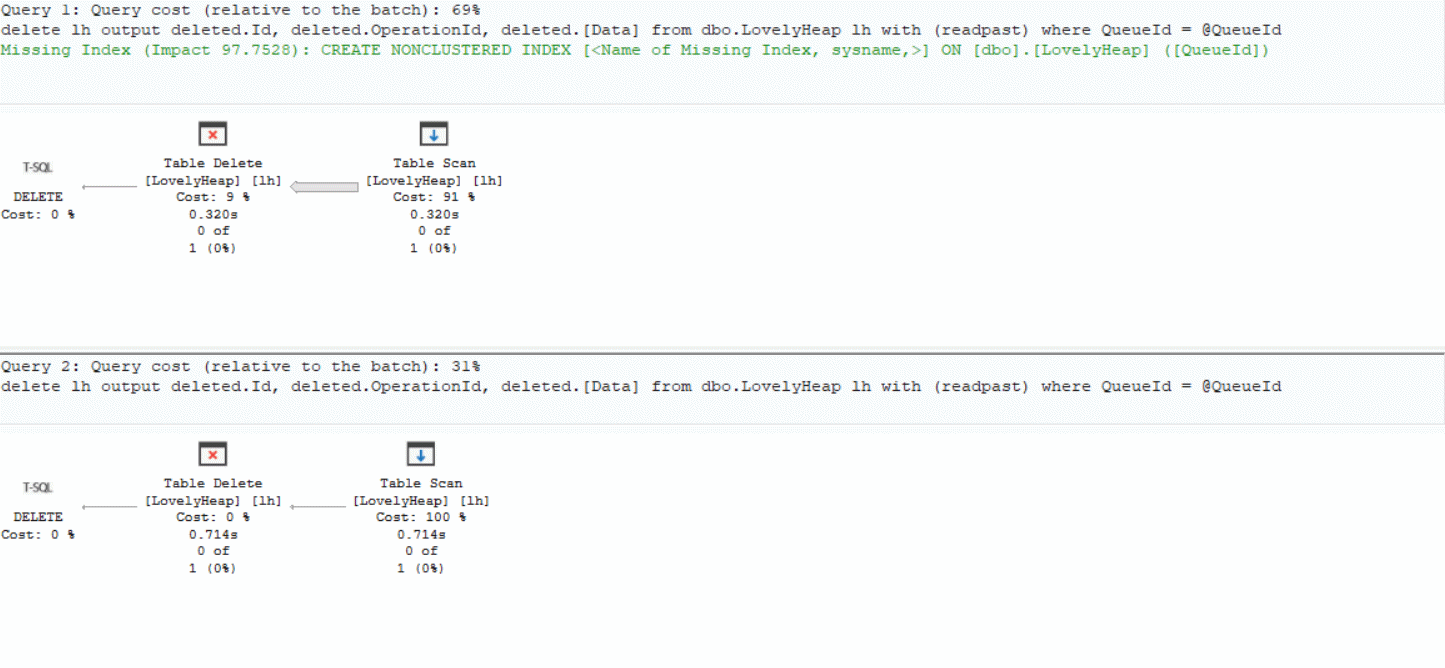 Looking at the execution plans:
- Scenario A: reads 2M rows in ~320 ms
- Scenario B: reads 0 rows in ~714 ms
In both cases the execution plan is the same, and the most expensive operator is a Table Scan. Weird, right?
Under the hood
Now let’s see what SQL Server is doing under the hood using Windows Performance Toolkit.
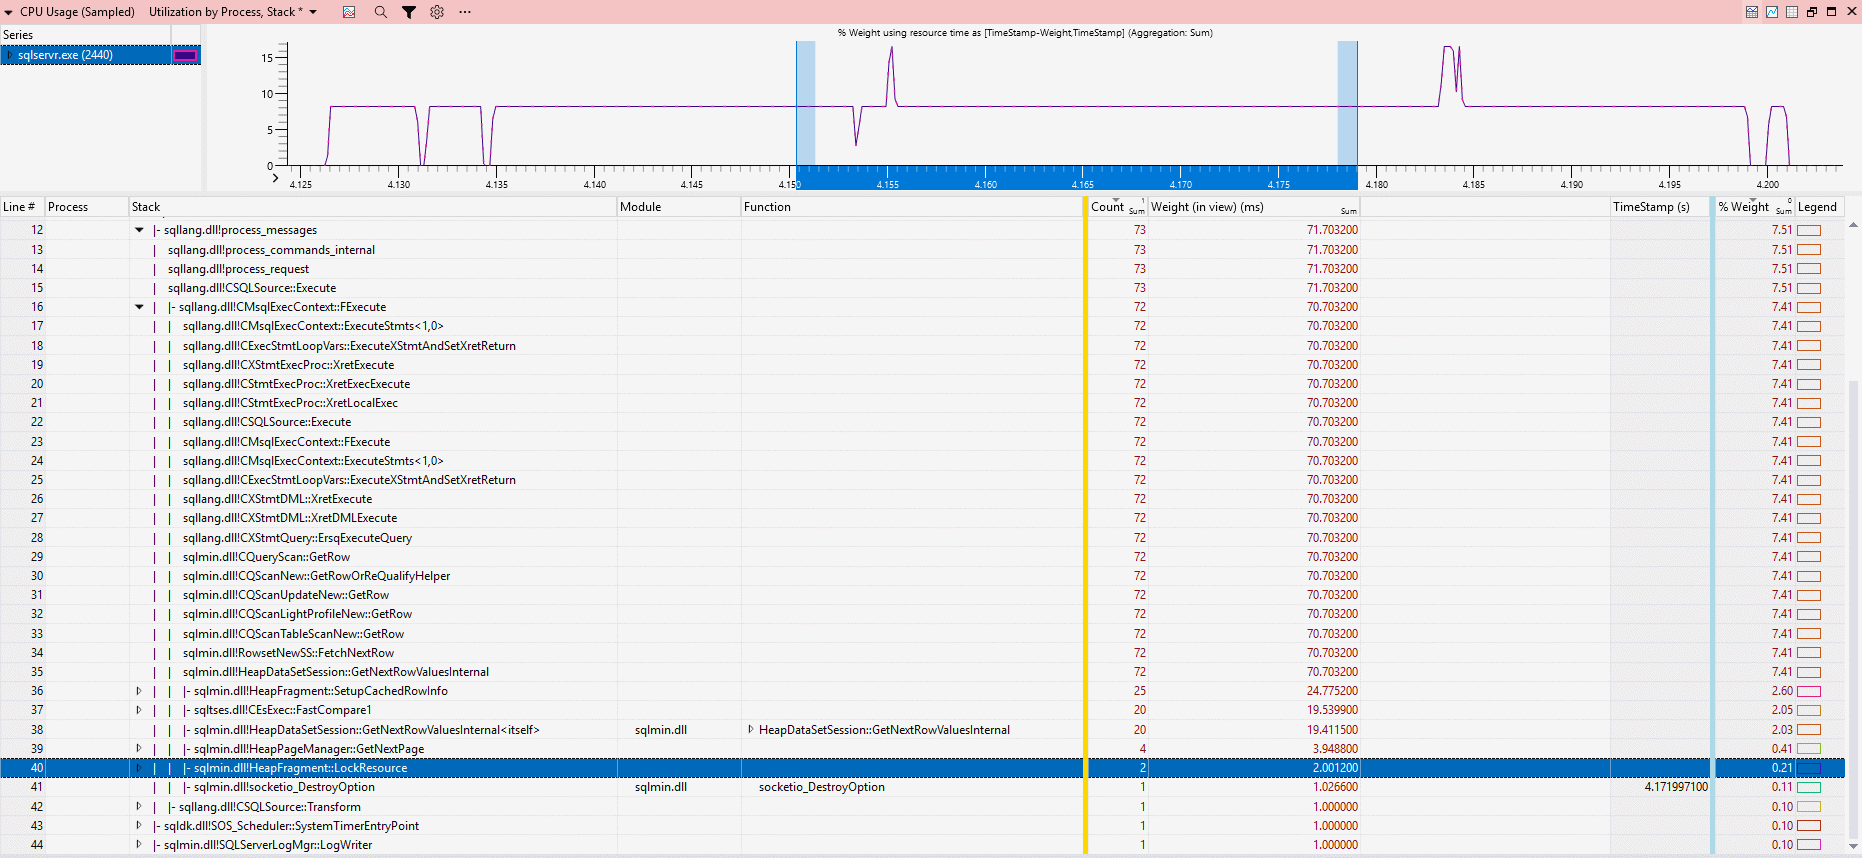
Stack trace for Scenario A (slice duration ~80 ms):
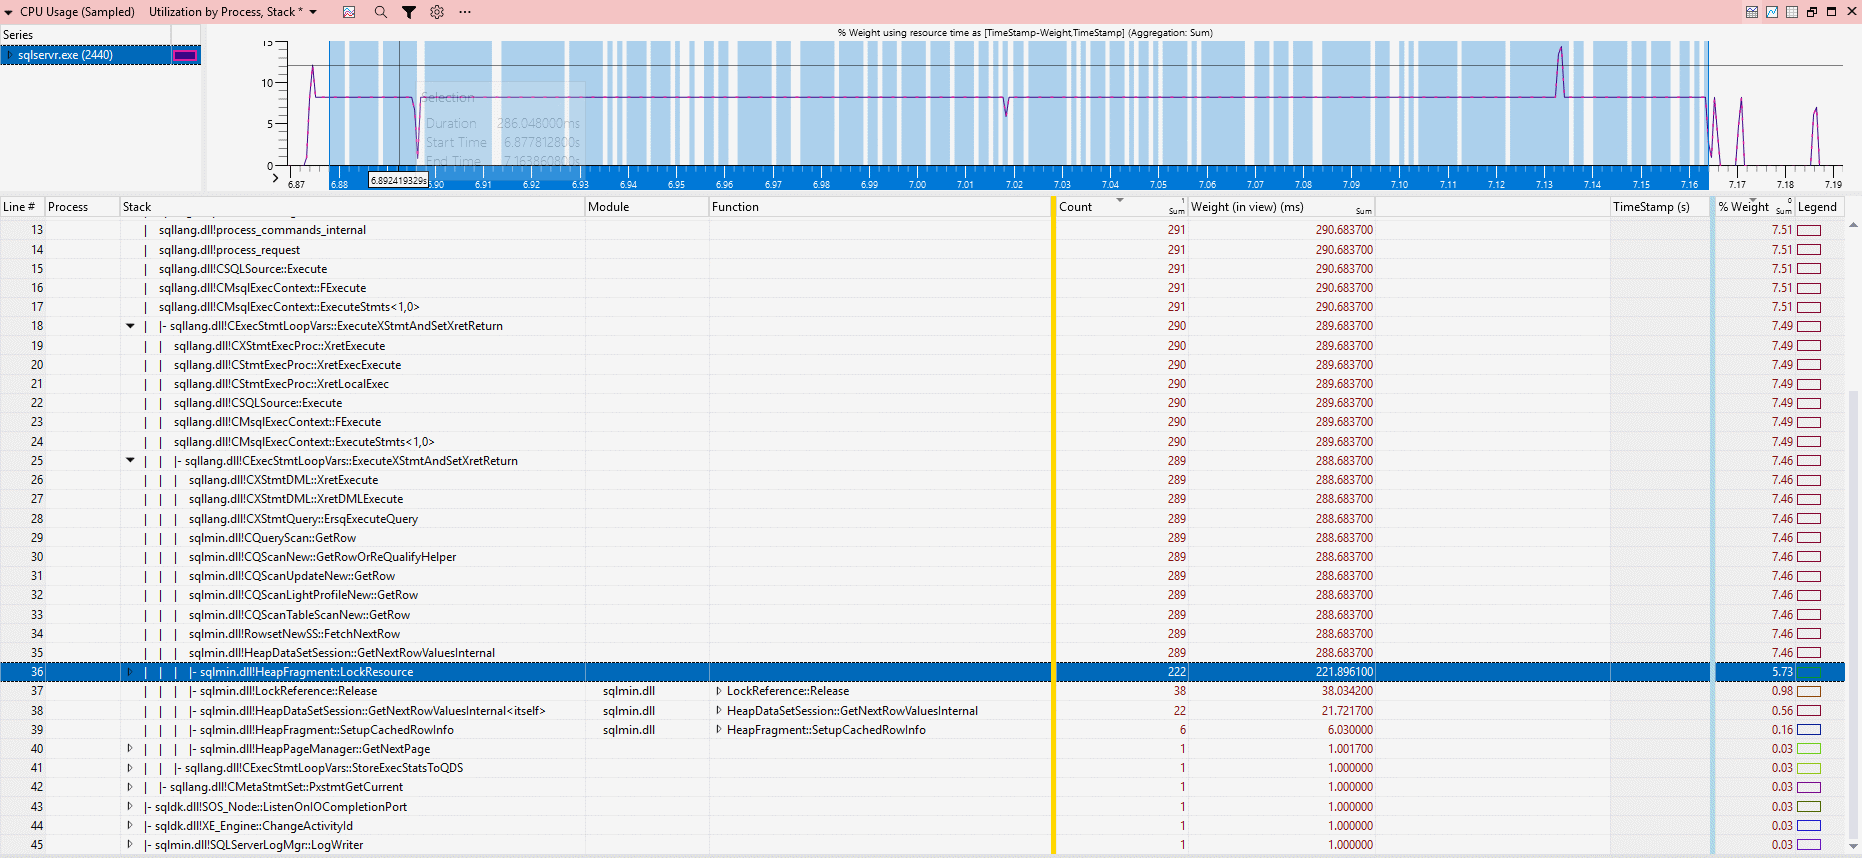
Stack trace for Scenario B (slice duration ~322 ms):
The key difference is locking behavior:
- Scenario A: 2 calls to
HeapFragment::LockResource, ~2 ms CPU - Scenario B: 222 calls to
HeapFragment::LockResource, ~221.8 ms CPU
Yes, I know - there are a lot of 2s here, but that’s purely accidental, I swear.
Anyway, that’s roughly 1 ms of CPU per HeapFragment::LockResource call.
Conclusion
At first glance, this behavior feels completely wrong: fewer rows, fewer logical reads, the same execution plan - yet 3× higher CPU and longer execution time. Why this happens isn’t obvious at first. But based on the investigation, the key difference is this - in Scenario B, the workload shifts from data processing to CPU-heavy internal synchronization and the engine spends most of its time on coordination overhead.
I have two takeaways for you:
- Sometimes, less data means more work for SQL Server
- Heaps are usually a poor fit for OLTP workloads. Without a clustered index, SQL Server relies heavily on allocation structures and page scans, which can lead to unpredictable performance like this. Heaps still have their place - for example, in staging tables or bulk data loading, but for most OLTP scenarios, a properly designed clustered index is the safer and more predictable option.
And to be honest, I don’t fully understand why it behaves this way. If you have a better explanation, feel free to share it in comments below the LinkedIn post.
Catch you next time!